This is an old revision of the document!
Table of Contents
WXP80 analog measurements
This page shows the analog measurements of the WXP80 heating element connected to an operation amplifier. From the results a formula is calculated to model this.
PTC resistance and voltages WXP80
The tip is heated up in small incremental steps using a DC power supply. After waiting for the temperature to stabilize (for each measurement about 7 minutes) the tip PTC temperature as well as resistance was measured. The small PCB in the WXP80 has a biased gain amplifier, With this the temperature is converted to a voltage, suitable for AD conversion. The WX2 supplies the opamp and the AD converter on the PCB with 4.66v. For these measurements the voltage was supplied externally and adjusted for small changes during warming up.
The schematic diagram (with Vdd 4.66v) for the biased gain amplifier is:
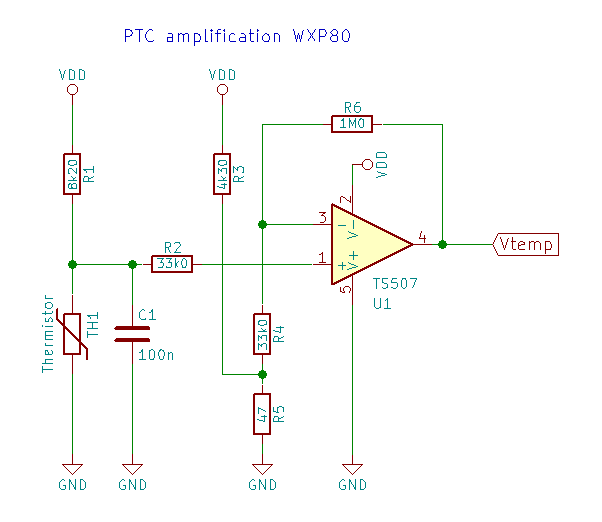
With increasing the temperature in steps, the resistance Rv of TH1 as well as the output of the opamp Vtemp was measured:
| Vheat-element (in V) | TH1 (in Ω) | Vtemp (in V) | Temp (in °C) | : | Vheat-element (in V) | TH1 (in Ω) | Vtemp (in V) | Temp (in °C) |
|---|---|---|---|---|---|---|---|---|
| 0.000 | 108.5 | 0.399 | 22.5 | : | 2.750 | 133.9 | 0.850 | 76.2 |
| 0.250 | 109.0 | 0.405 | 23.2 | : | 3.000 | 138.0 | 0.917 | 85.2 |
| 0.375 | 109.1 | 0.411 | 23.6 | : | 3.250 | 143.3 | 1.014 | 97.2 |
| 0.500 | 109.5 | 0.416 | 24.4 | : | 3.500 | 148.5 | 1.112 | 109.2 |
| 0.750 | 110.7 | 0.438 | 26.8 | : | 3.750 | 153.5 | 1.202 | 120.4 |
| 1.000 | 112.3 | 0.467 | 30.4 | : | 4.000 | 158.6 | 1.289 | 130.8 |
| 1.250 | 114.4 | 0.502 | 34.5 | : | 4.250 | 163.9 | 1.381 | 142.3 |
| 1.500 | 116.9 | 0.550 | 39.8 | : | 4.500 | 168.8 | 1.464 | 152.9 |
| 1.750 | 119.7 | 0.598 | 45.8 | : | 4.750 | 173.8 | 1.553 | 162.6 |
| 2.000 | 123.2 | 0.659 | 53.7 | : | 5.000 | 180.7 | 1.670 | 177.6 |
| 2.250 | 126.7 | 0.724 | 61.1 | : | 5.250 | 186.2 | 1.767 | 188.4 |
| 2.500 | 130.1 | 0.783 | 68.2 | : | 5.500 | 191.8 | 1.866 | 199.0 |
Entering this data in libre office calc, reveals the following graph:
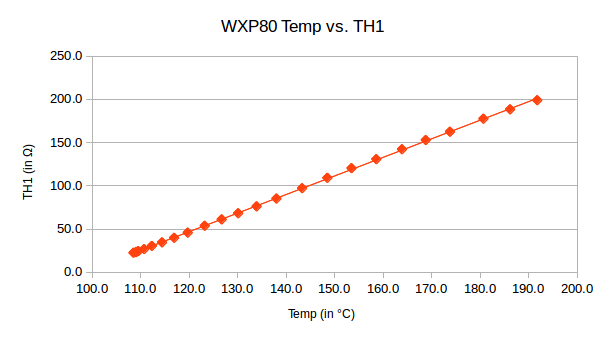
Based on the observations we assume that the relationship between temperature and resistance is linear. We can thus find a first order formula which approaches the data pretty well. A general function looks like:
$R = aT + b \tag{1}$
where a is the slope and b the intercept of the vertical-axis.
A formula to calculate the slope is:
$a = \frac{n (\sum\limits_{i=1}^n T_iR_i) - (\sum\limits_{i=1}^n T_i)(\sum\limits_{i=1}^n R_i)}{n (\sum\limits_{i=1}^n T_i^2) - (\sum\limits_{i=1}^n T_i)^2} \tag{1}$
where n is the number of samples (in our case 24 samples), T the temperature and R the resistance of TH1.
The intercept of the vertical axis is given with following equation:
$b = \frac{(\sum\limits_{i=1}^n T_i^2)(\sum\limits_{i=1}^n R_i) - (\sum\limits_{i=1}^n T_i)(\sum\limits_{i=1}^n T_iR_i)}{n (\sum\limits_{i=1}^n T_i^2) - (\sum\limits_{i=1}^n T_i)^2} \tag{2}$
With the data from the table above, the least squares trendline is:
$R = 0.465T + 98.17 \tag{3}$
where T is the temperature in °C and Rv the resistance of TH1 in Ω.
Please note that libre office offers an easy method to acquire this equation directly, using the 'show equation' option. It will show equation (3) right away:
The opamp is configured as a DC coupled non-inverting amplifier with a bias. To calculate the gain (G) and bias (Vb), we use following equations:
$G = 1 + \frac{R6}{R4 + \frac{R3 \cdot R5}{R3 + R5}} = 1 + \frac{1.0 \cdot 10^6}{33\cdot10^3 + \frac{33\cdot10^3 \cdot 47}{33\cdot10^3 + 47}} = 31.1 \tag{5}$
where R3 = 4.3kΩ, R4 = 33.0kΩ, R5 = 47Ω and R6 = 1.0MΩ
The bias voltage is a simply voltage divider with R3 and R5:
$V_b = V_{dd} \frac{R5}{R5 + R3} = 4.66 \frac{47}{47 + 4300} = 0.0501 \tag{6}$
where Vdd is 4.66v
We now are able to calculate a transfer function using the PTC resistor value to find the opamp output voltage relative to the temperature. (Alternatively we could calculate the transfer function using the least squares method of the output voltage data from the table above.)
The transfer function is:
Tools and measuring equipment
- Philips PE 1542 DC power supply
- Temperature: no-name kitchen-bread thermometer (max 199 °C)
- Fluke 87 multimeter
References
Page Tools
